Updated August 29, 2022

This session

In this short session you will be introduced to:

  1. Distinction between structured and unstructured data
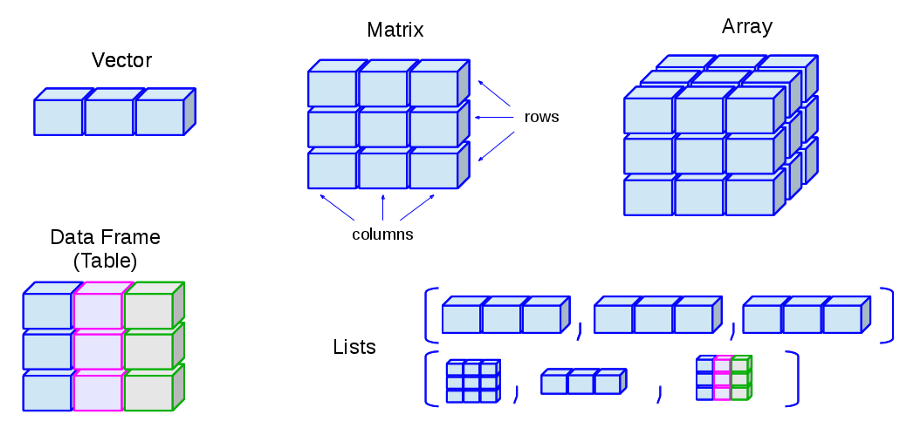
  2. Crashcourse in data dimensionality.
  3. The concept of “tidy” data.

Introduction

What to do with data?

Sources and Types of Data

Structured vs Unstructured Data

  • Structured data: M1
  • Unstructured data: M2

Structured Data

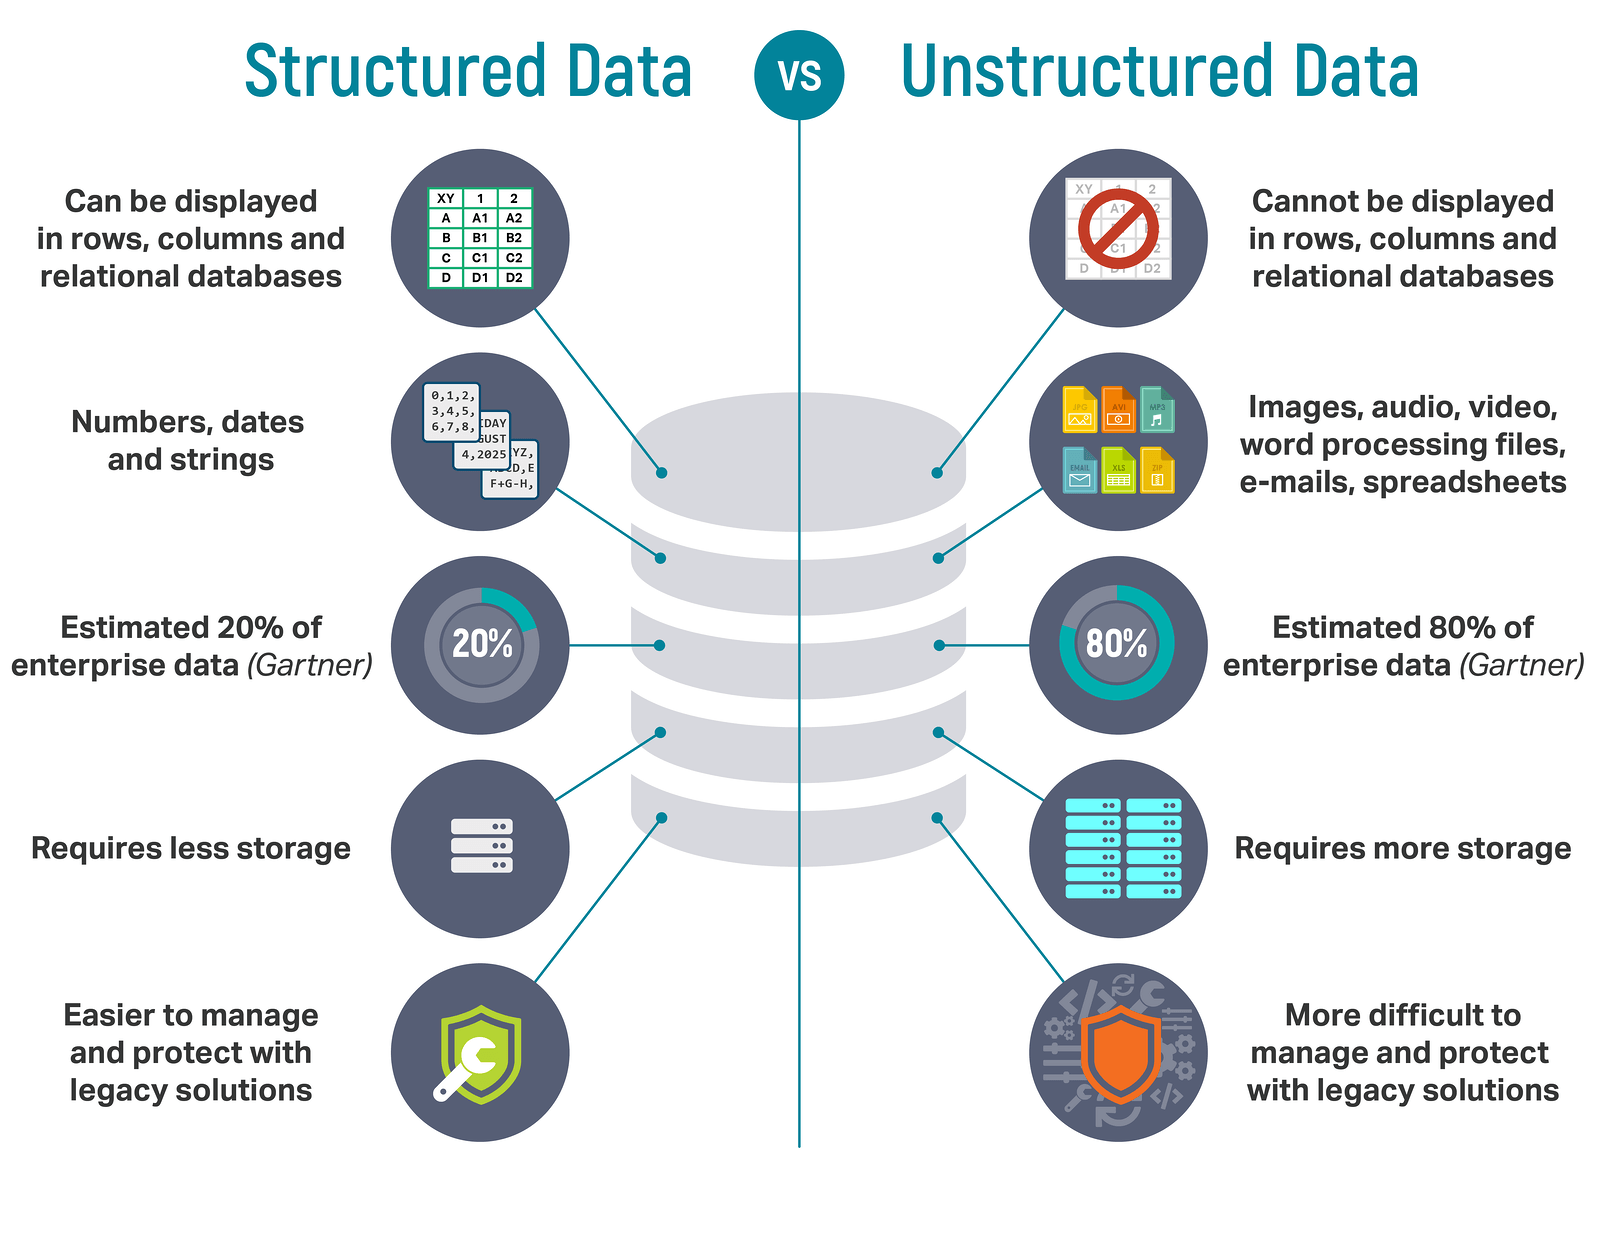
= Data that can be meaningful expressed in a tabular (row/column) format.

  • … Excel spreadsheets and similar are by design structured.
  • … Often a mix of quantitative (= numeric) qualitative (= categorical) data.
  • … Relatively easy to integrate in the usual DS/ML workflows.
  • … Relational Databases (RDBMS / SQL) connect information across structured datasets.

Structured (Relational) Data Example

  • A collection of tabular datasets.
  • All are conceptually linked (related to flights from NYC airport)
  • All are linked by key ID variables, allowing to join them.
  • Might com from a company’s ERP system, public statistical bureaus ect.

Unstructured Data

= everything else.

  • … has an internal structure (i.e. bits and bytes)
  • … but is not structured via pre-defined data models or schema, i.e. not organised and labelled to identify meaningful relationships between data
  • … may be textual / non-textual (tweets, images, audio, …)
  • … may be human / machine-generated.
  • … might also be stored within a non-relational database like NoSQL.

One big part in the preprocessing of ML/DS projects is often to bring unstructured data in a structured format.

You might need to handle some unstructured data, yet for the most part this is not content of this but later modules.

Data Share

Structured Data

Dimensionality of Data

Tidy data

  1. Each variable must have its own column.
  2. Each observation (corresponding to unit of interest) must have its own row.
  3. Each value must have its own cell.

Tidy data contd.

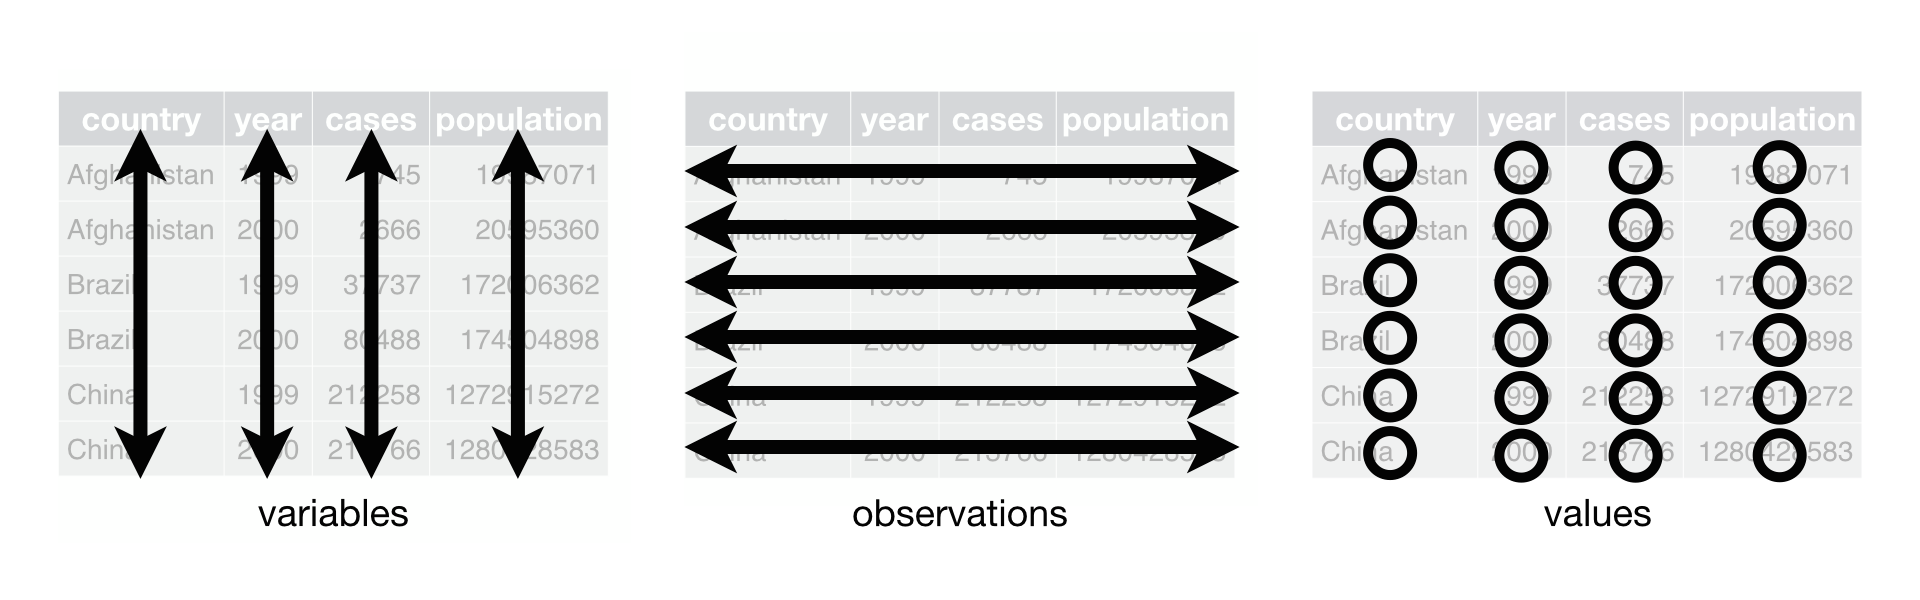
Why ensure that your data is tidy? There are two main advantages:

1.Consistent way of storing data. If you have a consistent data structure, it’s easier to learn the tools that work with it because they have an underlying uniformity. 2. Likewise, consistency in format eases the reuse of existing workflows to new DS/ML projects. 3. When working with structured data, having a row for every unit of observation facilitates analytic .

Summary

Main take-aways today:

  • We broadly distinguish between structured and unstructured data.
    • Structured data can be expressed in a tabular format.
    • Unstructured data cannot per se be expressed tabular.
  • Most DS/ML workflows are geared towards
  • The conversion of unstructured to structured data (preprocessing) is often a substantial part of the DS/ML pipeline.
  • The dimensionality of structured data may vary.
  • In most cases, a tidy (row = observation, column = variable) data structure is beneficial.